95% of initial abandonments
Customer support accounts for 30,017 of 31,602. Investigate its queues and demand first.
Power BI case study · Service operations
I analysed 197,278 contact-centre interactions to investigate access to human support, abandoned transfers and customer feedback. The result was a four-page Power BI report with defined metrics, quality checks and operational priorities.
Separating AI endpoints from calls routed to people establishes the right base for each rate.
4 unclassified calls sit outside the human-route base.
Human attention includes calls abandoned after contact. An AI endpoint does not confirm resolution.
Inbound, outbound and chat records preserved.
Of known inbound human routes, before human attention.
7,708 responses; zeros included provisionally.
5,127 valid scores; 7.50% coverage.
The question
This practical analytics case examines inbound calls, outbound attempts and chat activity in a telecommunications contact centre.
My contribution
I prepared and classified the source records, built the data model and measures, designed four report pages, reconciled the results and translated the findings into an investigation plan.
Delivered: a Power BI report and an analytical decision memo.
The Power BI report
The report separates executive monitoring, operational performance, customer experience and data quality. These aggregate previews retain the original Spanish labels.
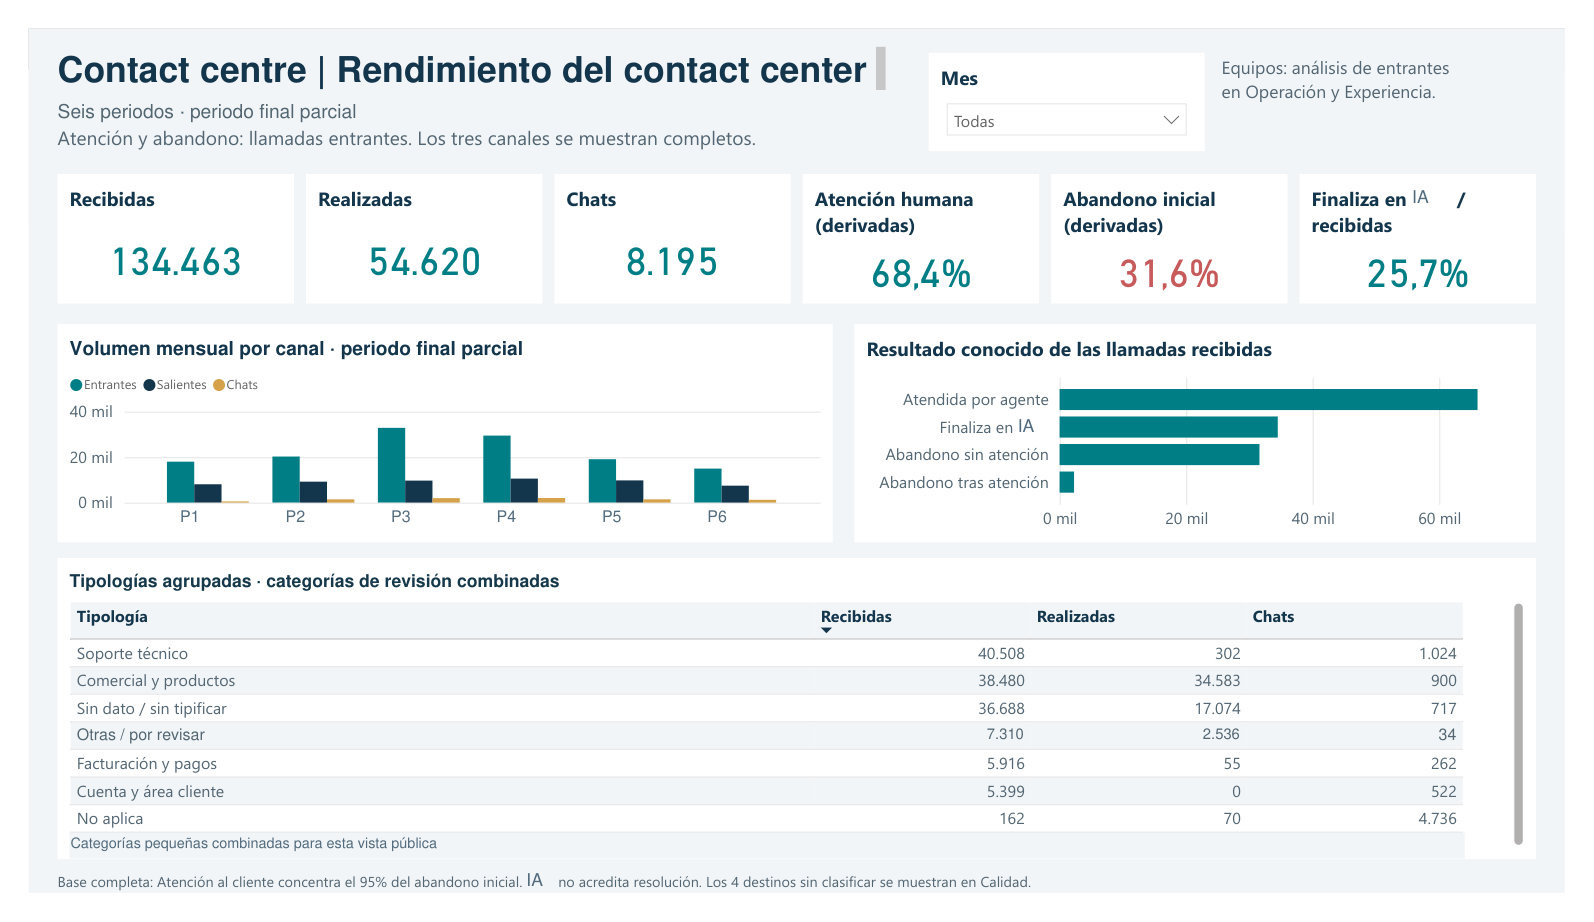
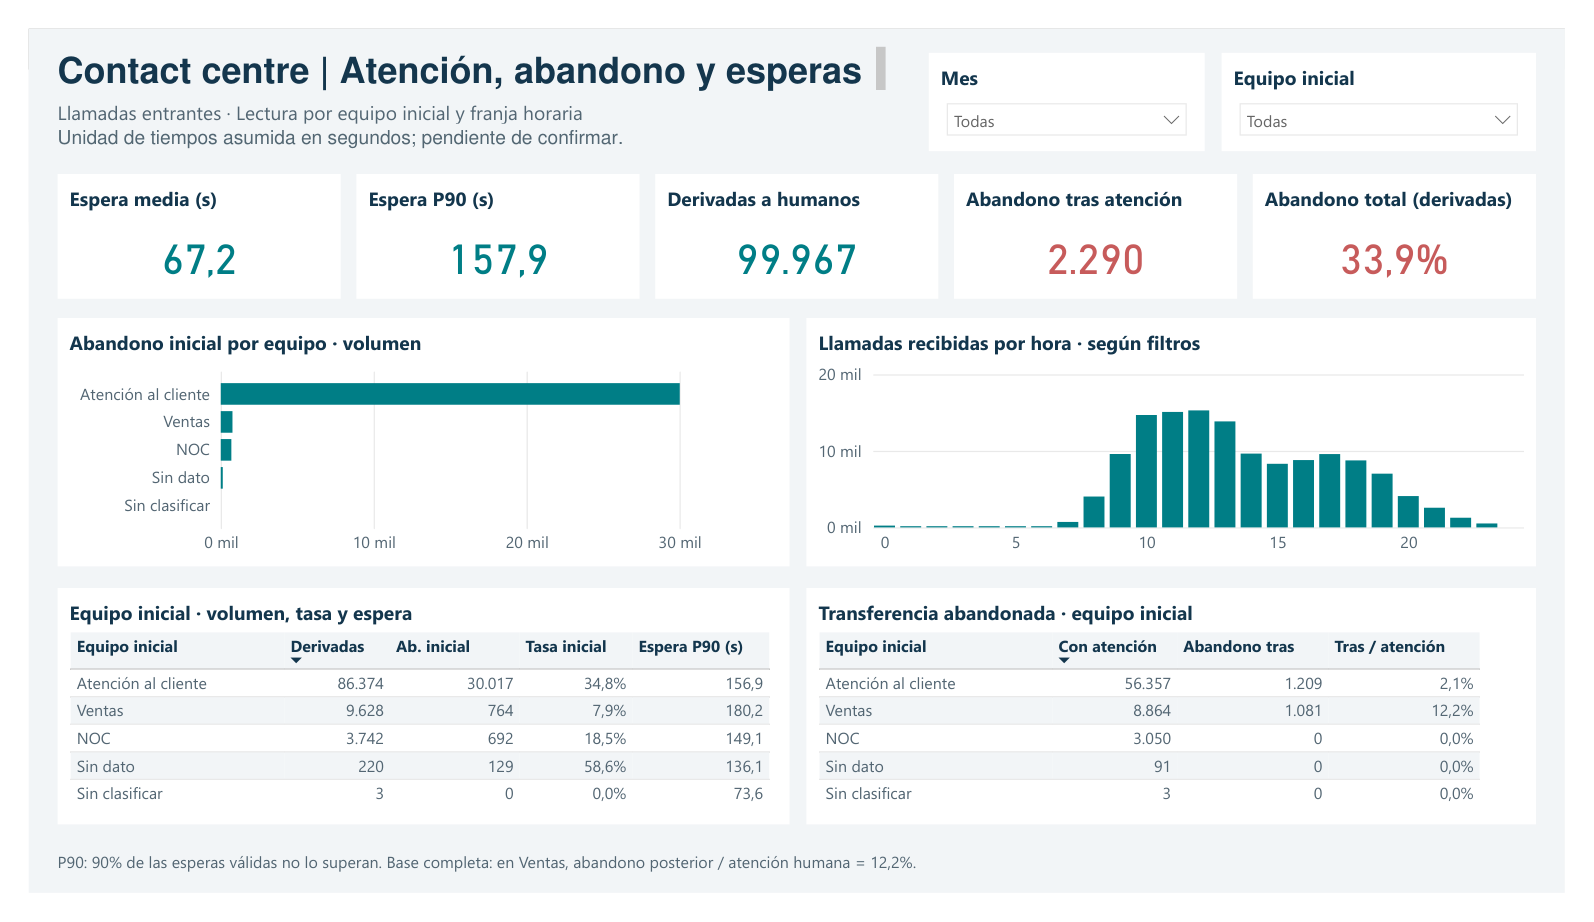
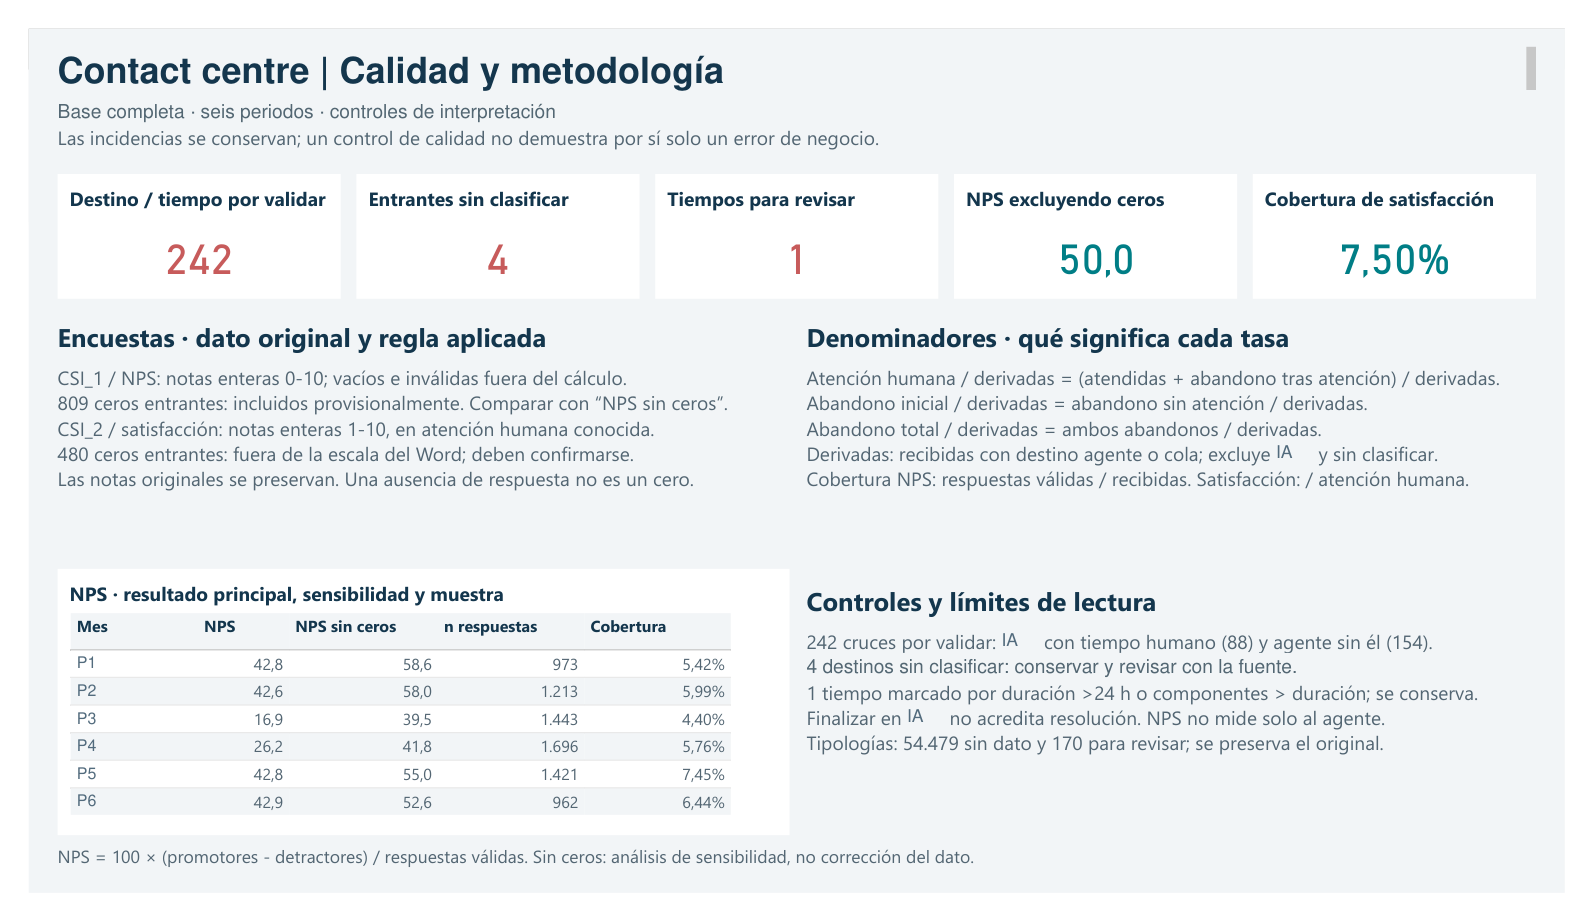
Customer support accounts for 30,017 of 31,602. Investigate its queues and demand first.
1,081 of 8,864 calls with human attention in the initial Sales group. Review the transfer journey.
The same data give different scores when zeros are excluded. Confirm recording rules before setting targets.
Operational evidence
Compare recorded volume, initial abandonment and the 90th percentile of waiting time on known inbound human routes. Period labels are generic in this public version; the final period is partial.
Choose a metric and period to inspect its values. Period 6 is partial. Waiting-time units are provisional; definitions and response bases are documented below.
| Period | All interactions | Inbound calls | Initial abandonment | Wait P90 | NPS |
|---|---|---|---|---|---|
| Period 1 | 26,153 | 17,965 | 37.94% | 146.1 s | 42.75 |
| Period 2 | 30,865 | 20,234 | 35.16% | 152.0 s | 42.62 |
| Period 3 | 44,436 | 32,827 | 46.09% | 164.3 s | 16.91 |
| Period 4 | 41,990 | 29,426 | 24.92% | 164.8 s | 26.18 |
| Period 5 | 30,250 | 19,066 | 11.58% | 140.6 s | 42.79 |
| Period 6 · Partial period | 23,584 | 14,945 | 17.83% | 156.2 s | 42.93 |
| All periods | 197,278 | 134,463 | 31.61% | 157.9 s | 34.28 |
| Recorded outcome | Calls | Share of inbound |
|---|---|---|
| Ends with AI | 34,492 | 25.65% |
| Agent terminal outcome | 66,075 | 49.14% |
| Initial abandonment | 31,602 | 23.50% |
| Abandonment after human contact | 2,290 | 1.70% |
| Unclassified | 4 | 0.00% |
Customer feedback
Net Promoter Score (NPS) measures willingness to recommend the company. I compared two zero-score policies because the brief describes a 1–10 scale but the records also contain zeros.
Promoters score 9–10, passives 7–8 and detractors 0–6. NPS equals the promoter share minus the detractor share, multiplied by 100.
All periods: 809 zero scores retained. NPS survey coverage is 5.73% of inbound calls.
One dataset, two definitions
The chart keeps the full −100 to +100 scale. Select a period to highlight its scores; exact values appear beside the chart.
This is a definition comparison, not a measured improvement. Satisfaction is separate: 9.46/10 from 5,127 valid 1–10 scores, covering 7.50% of calls with human attention.
| Period | NPS with zeros | Response base | NPS without zeros | Response base | Zero scores |
|---|---|---|---|---|---|
| All periods | 34.28 | 7,708 | 50.02 | 6,899 | 809 |
| Period 1 | 42.75 | 973 | 58.56 | 876 | 97 |
| Period 2 | 42.62 | 1,213 | 57.99 | 1,095 | 118 |
| Period 3 | 16.91 | 1,443 | 39.54 | 1,209 | 234 |
| Period 4 | 26.18 | 1,696 | 41.82 | 1,509 | 187 |
| Period 5 | 42.79 | 1,421 | 55.00 | 1,309 | 112 |
| Period 6 · Partial period | 42.93 | 962 | 52.61 | 901 | 61 |
The brief specifies 1–10; the records contain zeros. Their meaning remains unconfirmed, so the 0–10 calculation and its sensitivity scenario are both retained.
Method and validation
I preserved one row per interaction, separated channels and outcomes, and checked that each measure retained its definition as filters changed.
Type dates and durations, normalise keys, join the destination dictionaries and retain records requiring review.
Connect calendar and destination dimensions to the interaction records. Keep initial team separate from final endpoint.
Use DAX for route-based rates, waiting percentiles and feedback measures, with numerators and denominators in the same filter context.
Compare independent totals, inspect filter behaviour and verify the four report pages and exported results.
Checks that informed the analysis
242 destination/time combinations, 4 unmapped inbound destinations and 1 extreme-duration record were retained for review. A flagged record is an investigation case, not automatically an error.
The saved report was validated in Power BI Desktop. The public evidence preserves aggregate results and documented definitions.
Initial abandonment rate =
    Inbound calls abandoned before human attention
    ÷ Known inbound calls routed to humans

All-period calculation:
    31,602 ÷ 99,967 = 31.61%

Known human routes =
    66,075 agent terminal outcomes
    + 31,602 initial abandonments
    + 2,290 post-contact abandonments

AI terminal outcomes and 4 unclassified inbound calls
are outside this denominator.Decision logic
The findings support a targeted investigation plan. They identify where to look; capacity, routing and process evidence are still needed to explain the causes.
Support contributes about 95% of initial abandonments. Start with its arrival pattern, queue coverage and waiting-time distribution; assess whether staffing, routing or callback changes warrant a controlled test.
Sales records a 12.2% post-contact abandonment rate among calls that had human attention. Inspect transfer destinations, ownership and handoff steps before attributing the pattern to agent performance.
Confirm whether zero scores are submitted answers or defaults, retain the sensitivity comparison and track survey coverage alongside every score. Use comparable response bases before evaluating changes.
| Team | Known human routes | Initial abandonments | Initial abandonment rate | Post-contact abandonment rate |
|---|---|---|---|---|
| Customer support | 86,374 | 30,017 | 34.75% | 2.15% |
| Sales | 9,628 | 764 | 7.94% | 12.20% |
| Network operations | 3,742 | 692 | 18.49% | 0.00% |
| Other | 223 | 129 | 57.85% | 0.00% |
No intervention was implemented in this case study. The recommendations are proposed next steps, with impact to be measured after implementation.
Project evidence
The public package separates auditable aggregate outputs from the concise business narrative. Definitions and response bases travel with the results.
Channel and outcome totals, generic period summaries, broad team comparisons and a metric dictionary.
PDF · Executive case summaryAnalytical method, operational priorities, feedback sensitivity and limitations in a concise document.